When your Mac goes wrong, the first step to fixing the problem, is working out what caused that problem in the first place!
Regardless of whether you plan to fix the issue yourself, or pass your Mac along to technical support, the first step should always be gathering more information.
The good news is that behind the scenes, your Mac keeps a log of everything it does, and you can use these logs to figure out exactly what’s going wrong with macOS, or any of the applications you’ve installed. These logs are invaluable if you want to try and fix the problem yourself, but they can also help support staff get your Mac back up and running, as quickly and painlessly as possible.
In this article, I’ll show you how to access and view these logs using macOS’ built-in Console application. Since these logs tend to contain an overwhelming amount of information, I’ll also be sharing tips on how to zero in on exactly the information you need, in order to diagnose what’s wrong with your Mac.
Viewing your Mac’s system logs
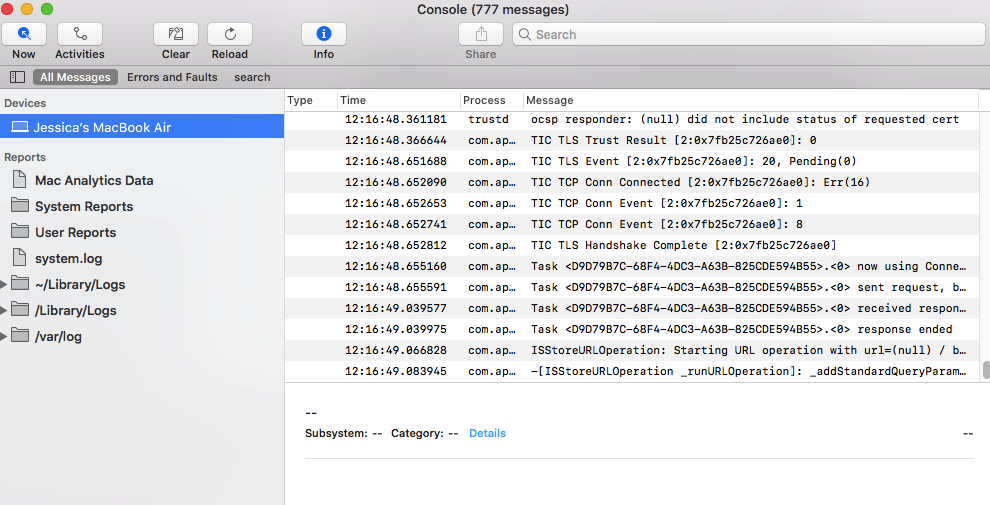
You can view all of your Mac’s system logs in the Console application, which you’ll find in your ‘Applications > Utilities’ folder.
The Console app is divided into an ‘All Messages’ tab, which displays all the available logs, and an ‘Errors and faults’ tab, which displays error messages only.

In the left-hand menu, you’ll find the following logs and information:
- Mac Analytics Data. This section contains information about system processes and applications. From left-to-right, each line displays a timestamp, the name of the process or application, and the related log message. If you’re ever unsure about a process, then copy/pasting it into your favourite search engine can usually shed some light on which part of the system or application this process relates to.
- System Reports. This section contains the logs for crashes and freezes. Selecting any of the reports in this section will launch a window displaying more information about that report.
- User Reports. This section contains the logs for crashes and freezes that have affected your applications. Once again, double-clicking any report will display more information about that report. If you’re encountering issues with a particular application, then sharing these reports with the application’s developer can help them to diagnose what’s going wrong with their app. The easiest way to share a report or log, is to copy/paste its contents into a plain text document, which you can then share via all the usual channels.
- System.log. This is the system log folder.
- ~/Library/Logs. This is where you’ll find your system-wide application log.
- /Library/Logs. This section contains user-specific application logs. If an application on your Mac isn’t behaving as expected, then this log can provide its developers with useful background information to help them diagnose the issue as quickly as possible. The only way to view the /Library/Logs for another user, is to sign into that person’s account and then launch their ‘version’ of the Console application.
- /var/log. This folder contains logs for low-level system services.
Struggling to find what you’re looking for?
Every time you launch the Console, you’re confronted with so much information that it can feel overwhelming! Plus, the Console is updating all the time, so you’ll always have new information to sift through.
Finding the information you need can be a challenge, but you can often cut through the noise using the following techniques:
- Only care about error messages? When you’re troubleshooting a problem, the information in the ‘All Messages’ tab can sometimes be an unnecessary distraction. At least initially, try limiting your search to the ‘Errors and faults’ tab.
- Hit pause! By default, the Console continually updates with new logs, reports and general information. When you’re investigating a problem that’s recently occurred, all of this new data might just be burying the information that you’re really looking for. You can temporarily freeze the Console, by clicking the ‘Now’ button, towards the Console’s upper-left corner.
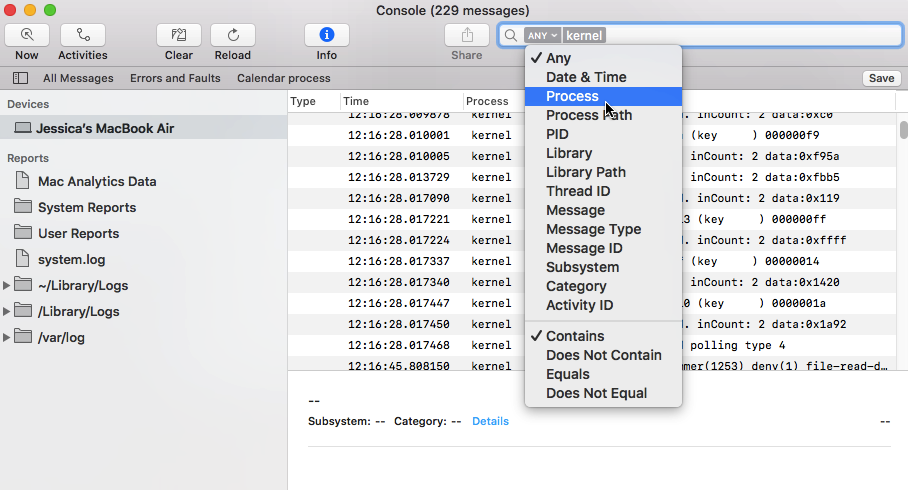
- Search smarter. If you have a rough idea of the kind of information you’re looking for, you can often zero in on that information, by entering a related search term. To perform a search in the Console, type a word or phrase into the ‘Search’ bar and then press the ‘Enter’ key on your keyboard. At this point, a new ‘Any’ item will appear in the search bar; clicking this item will open a dropdown where you can choose from a number of different search criteria, including date and time, process, and message ID. If you build a search query that you believe you’ll use on a regular basis, then you can store this search for future use, by clicking the ‘Save’ button. Your saved searches will appear in the Console toolbar, alongside the ‘Errors and faults’ tab, for example in the following screenshot the Console contains a saved search named ‘process.’


Add Comment