Activity Monitor is one of those essential applications which can help you monitor precisely what your Mac is doing. If you have any issues with system performance or wayward processes, Activity Monitor should be the first port of call to analyse what’s going on, and to check whether anything is using too much memory or misbehaving.
This article describes Activity Monitor in detail and explores some of its major features and capabilities.
How to Use Activity Monitor
The first thing to do is open Activity Monitor. It can be found in the Applications -> Utilities folder, or just type its name into Spotlight (the Spotlight shortcut is COMMAND + SPACEBAR).
The main window is displayed as follows.
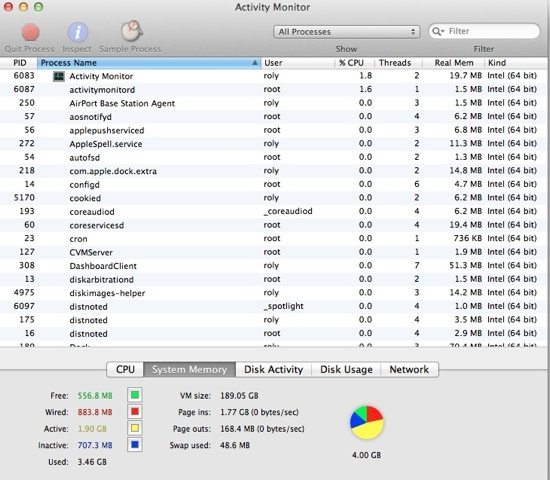
The main window is where every process and application running on your Mac is listed, together with a whole bunch of related details in each column – for example:
- Process ID (PID)
- Process Name
- User
- %CPU
- Threads
- Real Memory
- Kind
It’s possible to view additional columns by selecting them from the View menu, by expanding the Columns option and choosing the ones you want to view:
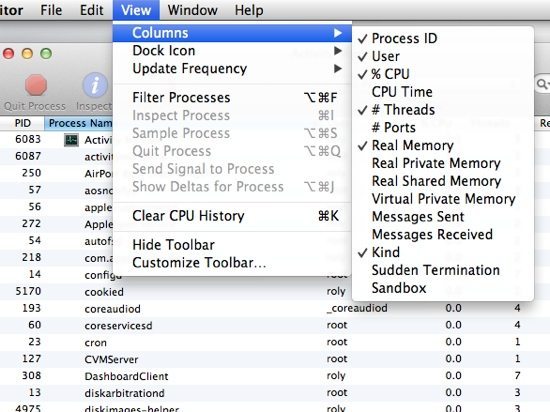
You can sort the information displayed by any of the columns in ascending or descending order. Just click on the column header once or twice to sort by that column and change the order. There is also a Filter box at the top right, that lets you enter the process name you want to view, for example if you type “Sky” any process that matches will be displayed (such as Skype).
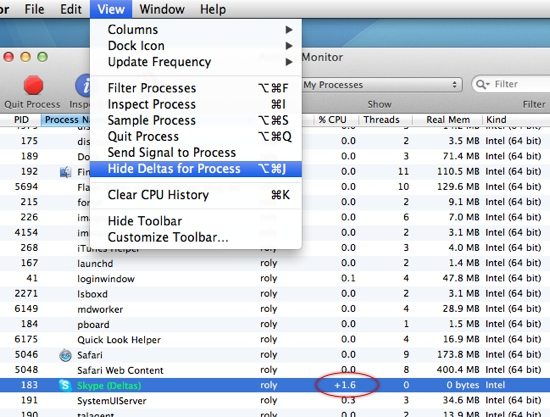
To view the deltas (i.e. the changes in status such as CPU usage), go to the View menu and choose Show Deltas for Process (COMMAND + SHIFT + J). This lets you view only the differences in status as follows:
To view each type of system process running, use the small drop-down list found at the top of the window.
Options are as follows:
- All Processes – every process running on your Mac
- All Processes, Hierarchically – shows child processes in a hierarchy
- My Processes – only those processes related to your user account
- System Processes – items such as the system log processes
- Other User Processes – items running under another user account
- Active Processes – anything that’s currently not idle
- Inactive Processes – idle processes which aren’t currently doing anything
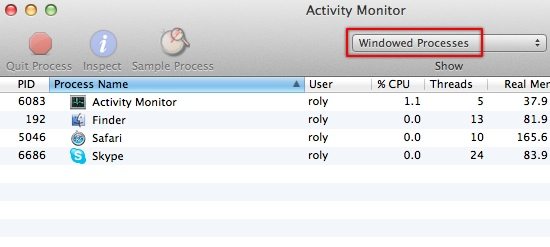
- Windowed Processes – any process that has a window open
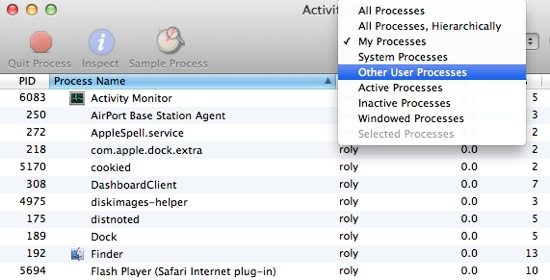
As an example, if you choose only Windowed Processes, you’ll see a list of every process or application that has a window open somewhere on your Mac (in the current space or elsewhere):
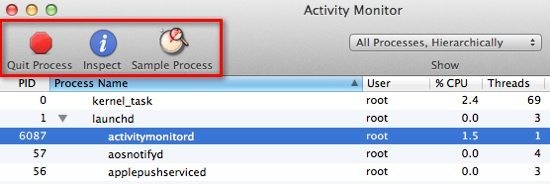
There are also three controls found at the top left of the window, namely Quit Process, Sample, and Inspect Process.
Along the bottom of the main window, additional information is displayed related to CPU, System Memory, Disk Activity, Disk Usage, and Network.

Terminating a Process
If you need to terminate (sometimes referred to as killing) a process, you first need to identify the process or application in the list.
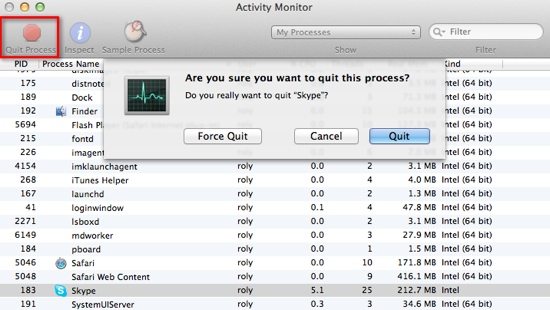
For example, if you want to terminate Skype (perhaps it’s become unresponsive or frozen), scroll down the process list (or use the search filter) and highlight it. Select the red Quit Process button and then choose Quit or Force Quit to confirm as below.
The difference between these two quit functions is that Quit performs a “soft” quit which gives the application time to gracefully terminate, whereas Force Quit just exits the process or application immediately. It’s advisable to use Quit first and if that doesn’t work, use Force Quit instead.
Inspecting a Process
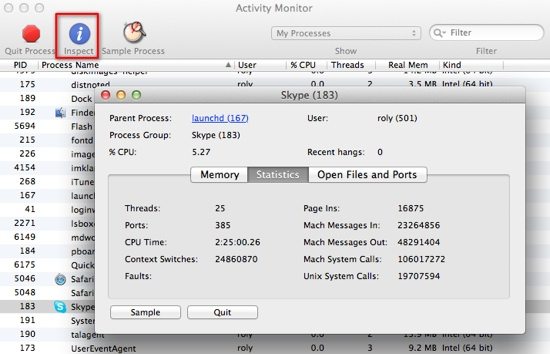
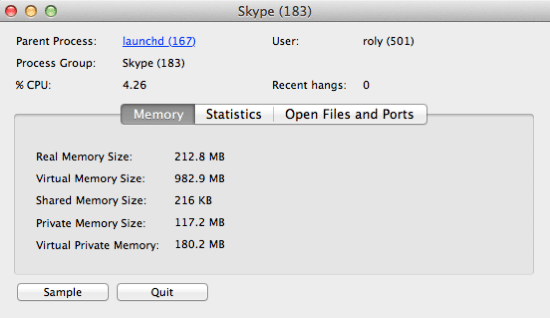
To view more details about an individual process, highlight it in the main window then use the blue Inspect button. A new window opens which shows vital statisticsabout that process, such as its CPU use, the parent process (i.e. what launched it – which is launchd in most cases), the memory used, CPU time used, any open files and the number of times the process has hanged. This is very useful information that allows you to see the status of any process on your Mac.
Here’s an example of the details shown in the Memory section.
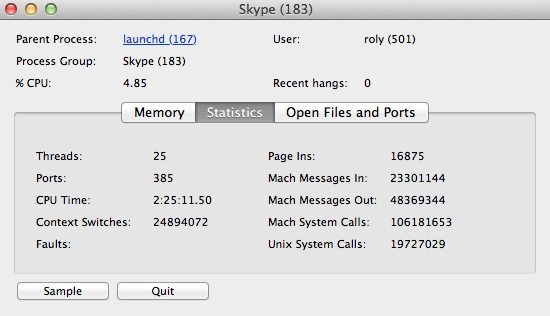
The Statistics section displays details such as the threads used, the number of ports and the number of system calls it’s made to Mac OS X.
Finally, the Open Files and Ports tab shows all the files being used (such as images, resources and cache files):
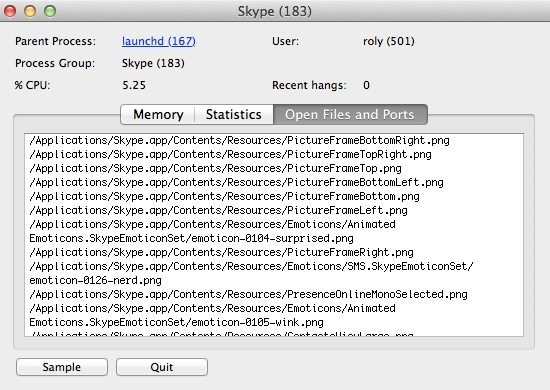
From the three tabs, you can sample a process with the Sample button or terminate the process using Quit (note that the quit button doesn’t close the inspection window but actually terminates the process, so remember to close the inspection window using the red button at the upper left corner of the window as normal.
Sampling a Process
The ability to sample a running process is a very useful feature of Activity Monitor. The output might at first look confusing, but it let’s you see exactly which functions the application / process is executing over a period of time. Samples are usually performed every millisecond.
A typical sample output looks something like this:
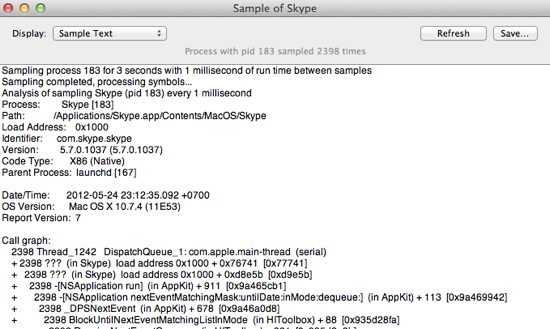
Why is this useful? It’s a great debugging tool in fact. Consider the case when you’re using an application like Photoshop. You might experience regular hangs or crashes when you do something as simple as opening a file. To diagnose the problem you could use Activity Monitor to take a sample and see what the application is really doing – you might find that it’s trying to make a call to your print server for example, which would allow you investigate whether your networked printer is working OK.
There could quite literally be thousands of reasons why an application hangs, but taking a sample can occasionally help you find the solution, and you don’t necessarily have to be that technically competent. Another reason to take a sample is that there are lots of helpful people in Internet forums who might be able to determine the cause of your issue just by taking a look at the sample output (since you can save it as a text file).
Send a Termination Signal to a Process Manually
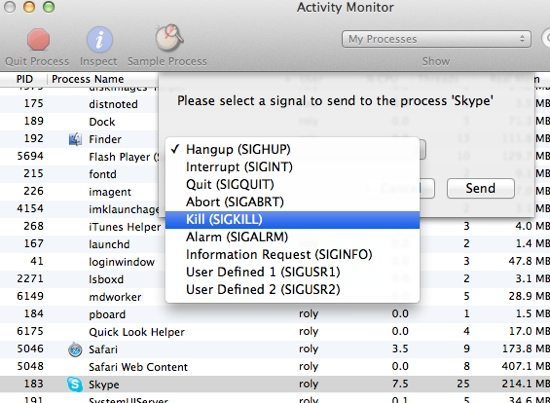
Activity Monitor also gives you a bit more control over how you interact with each process. It uses the concept of UNIX-style signals, which can be sent by Mac OS X to the process. Not every signal will elicit a response from the application / process, but those below (such as SIGKILL) are intended make the application terminate.
The complete list of signals that you can send to an application / process from Activity Monitor are:
- Hangup (SIGHUP)
- Interrupt (SIGINT)
- Quit (SIGQUIT)
- Abort (SIGABRT)
- Kill (SIGKILL)
- Alarm (SIGALRM)
- Information Request (SIGINFO)
- User Defined 1 (SIGUSR 1)
- User Defined 2 (SIGUSR 2)
To send one of these signals to a process, hit Send Signal to Process from the View menu and select the process from the drop-down list, then press Send. It may not be explicitly clear what each signal does what (for example sending SIGUSR 1 to Skype causes it to terminate) but they all pretty much do the same thing.
Changing the Dock Icon
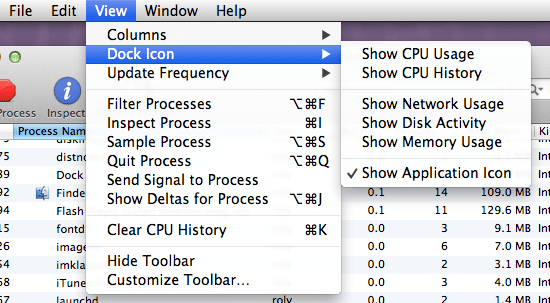
If you want leave Activity Monitor open (or set it to run when you login), it’s useful to change its Dock icon from the default to one of the other options.
You can choose from:
- CPU usage
- CPU history
- Network usage
- Disk activity
- Memory usage
To change the icon, go to Activity Monitor’s View menu and expand the Dock Icon sub-menu, or just right-click on the Activity Monitor icon in the Dock and choose the option you want.
Activity Monitor’s CPU Usage icon looks like this when enabled in the Dock:
![]()
And the CPU Usage History icon looks like this:
![]()
That’s just about all there is to using Activity Monitor. It’s a good idea to play around with it to learn the full extent of its capabilities, as it’s certainly an invaluable tool to help you monitor everything that’s running on your Mac.


Add Comment